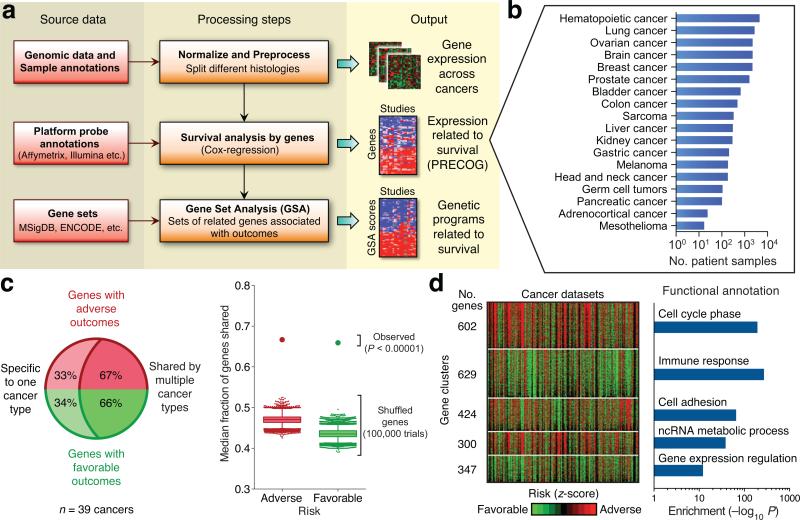
Figure 1. Prognostic landscape of gene expression across human cancers.
(a) Schematic depicting PRECOG data pre-processing and analysis steps. (b) Number of patient samples with survival data included in PRECOG, organized by cancer type. Thirty-nine distinct histologies (e.g. adenocarcinoma and squamous cell carcinoma in lung cancer, different types of blood cancer) have been grouped into 18 clusters for concise display. (c) Left: Approximately 2/3 of prognostic genes (filtered for |meta-z| > 3.09, or nominal one-sided P < 0.001) are prognostic in more than one of the 39 distinct cancer histologies for which meta-z scores were computed, while the remaining 1/3 are prognostic in only a single histology; the latter are cancer-specific. Right: Same analysis shown in the left panel but applied to randomly shuffled gene labels for each cancer in PRECOG. Based on 100,000 trials, the empirical P value for the observed enrichment of shared genes is P < 10−5. (d) Left: Heat map showing genes (rows) clustered by association between expression levels and survival outcomes across 166 individual cancer studies (columns). Z-scores represent the statistical significance of each gene's association with survival, with poor prognosis genes colored red, and favorable prognosis genes colored green. All identified clusters were ranked by compound scores that integrate cluster size with the prognostic significance of genes within each cluster; the top five ranking clusters are shown (left; Methods). Right: Representative functional enrichments for each of the five clusters, determined by analyzing annotated gene sets with a Bonferroni-corrected hypergeometric test. All clusters, including associated datasets and compound scores, are provided in Supplementary Table 3.

