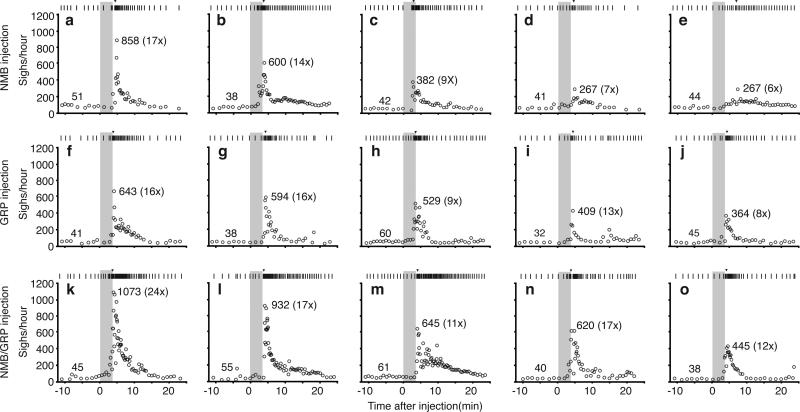
Extended Data Figure 4. Effects on sighing in individual rats following bilateral injection into preBötC of NMB, GRP and both NMB/GRP.
a-e, Raster plot of sighs (upper) and instantaneous sigh rates (lower) before and after NMB injection for the five experiments (a-e) shown in Figure 2d. f-j, Raster plot of sighs (upper) and instantaneous sigh rates (lower) before and after GRP injection for the five experiments (f-j) shown in Figure 3c. k-o, Raster plot of sighs (upper) and instantaneous sigh rates (lower) before and after NMB/GRP injection for the five experiments (k-o) shown in Figure 4i. Grey, injection period; arrowhead in raster plots, maximum instantaneous sigh rate; numbers, basal (left) and maximal instantaneous sigh rate (right) and fold induction (in parentheses) after neuropeptide injection.

