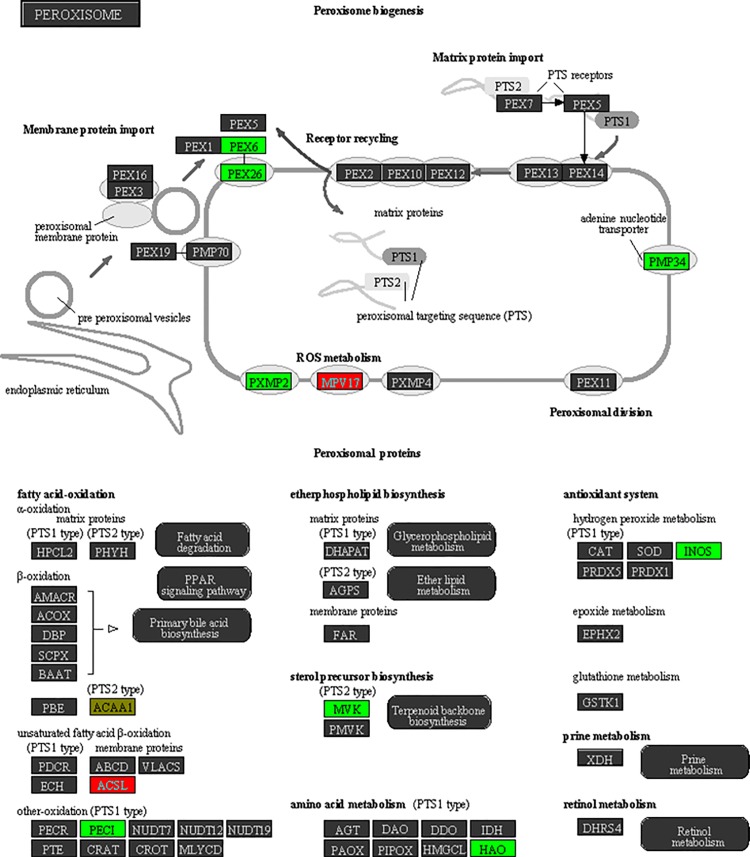
Fig 4. Schematic of peroxisome Biogenesis pathway from Partek pathway.
Proteins are arranged into functional groups. Proteins whose genes bear DMRs or RDHMs in their promoter are colored: genes with a change predicted to increase gene expression are shown in red, those predicted to decrease are shown in green, conflicting marks are shown in yellow. Score determined in Partek was 5.4 (right-tailed Fisher’s exact test).

