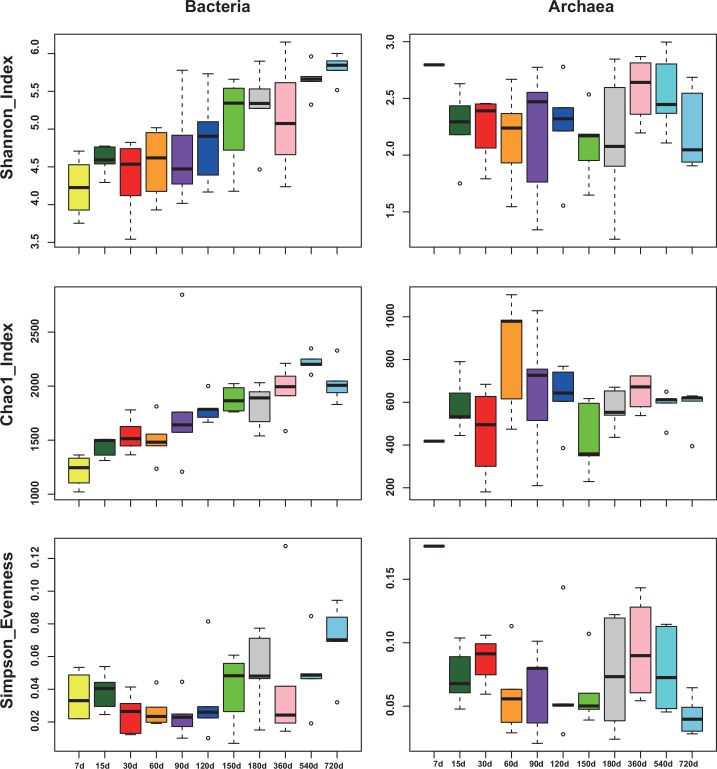
Fig 3. Alpha diversities within each age group in bacteria and Archaea respectively.
Diversity was measured by Shannon index; Richness and evenness were measured by the Chao 1 and Simpson evenness index, respectively. The top and bottom boundaries of each box indicate the 75th and 25th quartile values, respectively. The horizontal lines within each box represent the median values.

