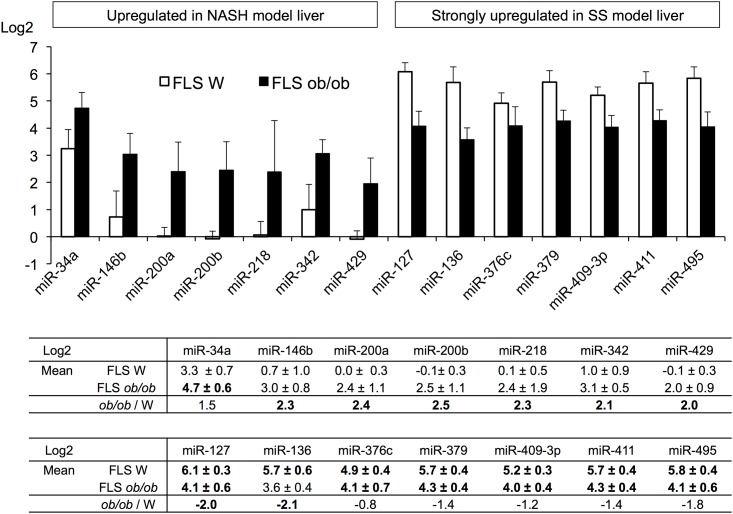
Fig 3. Relative expression of candidate miRNAs in liver tissue from mouse models of SS or NASH.
Microarray data were used to identify these candidates, and qRT-PCR from four specimens was used to determine the validity of the microarray findings. All candidate miRNA qRT-PCR data were normalized to U6 RNA data, and fold changes were calculated relative to data from normal control DS liver.

