
Fig 1. Structure of pulchrin A with selected HMBC and COSY correlation.
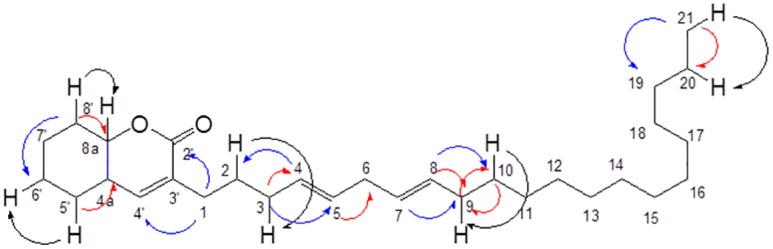
The HMBC correlation is highlighted with red and blue arrows indicated as J2 and J3, respectively, while COSY correlations in black arrow color.
Official websites use .gov
A
.gov website belongs to an official
government organization in the United States.
Secure .gov websites use HTTPS
A lock (
) or https:// means you've safely
connected to the .gov website. Share sensitive
information only on official, secure websites.
The HMBC correlation is highlighted with red and blue arrows indicated as J2 and J3, respectively, while COSY correlations in black arrow color.