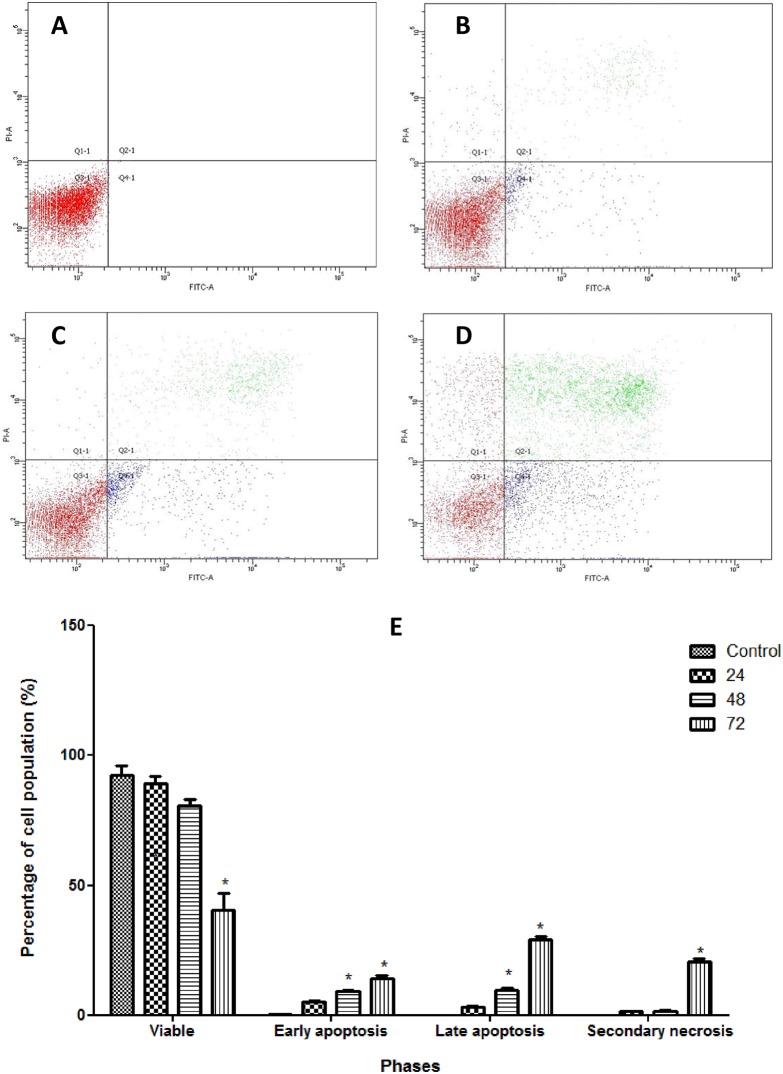
Fig 4. Analysis of Annexin V-FITC in CAOV-3 cells treated with pulchrin A in timely-dependent manner.
[A] Control (untreated), [B] 24 h, [C] 48 h, [D] 72 h. Dark red, blue, green and light red color indicated viable, early apoptosis, late apoptosis and secondary necrosis, respectively. Movement of the cell population was started in Q3 (viable cells) to Q4 (early apoptosis) to Q2 (late apoptosis), and finally to Q1 (secondary necrosis). [E] Histogram of the cell populations of viable, early-apoptosis, late-apoptosis and secondary-necrosis CAOV-3 cells. Results were represented as mean ± SD of three replicates. *p<0.05 indicates significant difference from control.

