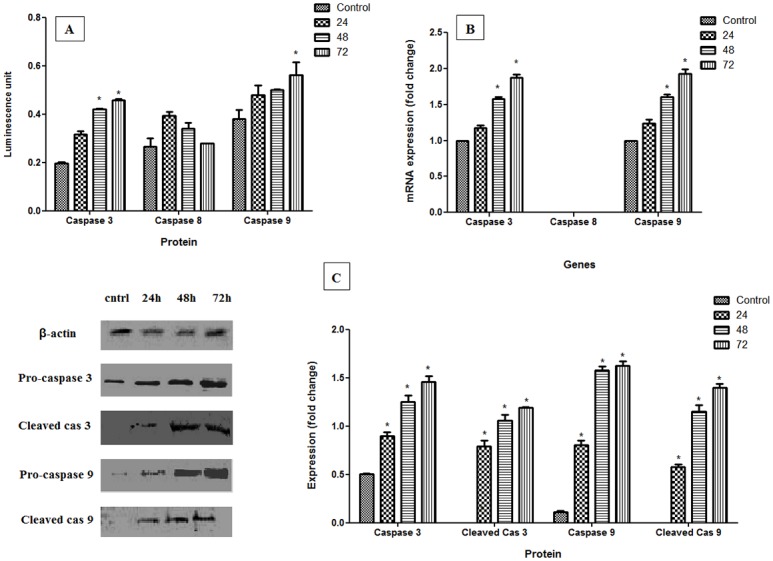
Fig 5. Involvement of caspases on CAOV-3 cells after treatment with pulchrin A for 24, 48 and 72 h of treatment.

[A and B] Colorimetric and real-time PCR analysis of caspases 3, 8 and 9, respectively. [C] Western blot analysis characterized by images and histogram for pro-caspases and cleaved caspases. Results were represented as mean ± SD of three independent experiments. The significant difference is expressed as * p<0.05.
