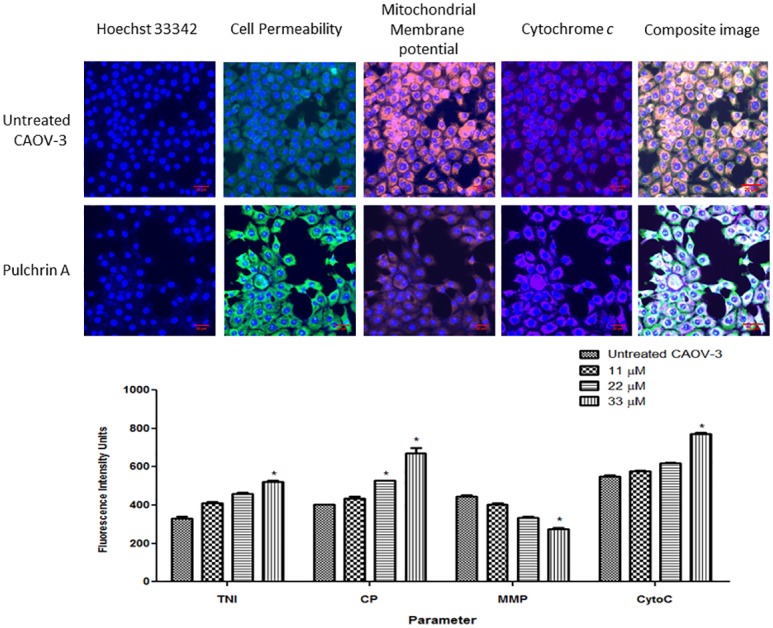
Fig 6. Fluorescence imaging and quantitative analysis of CAOV-3 cells treated with pulchrin A and untreated CAOV-3 cells against mitochondrial parameters.

The cells were stained with Hoechst, cell permeability, mitochondrial membrane potential (MMP) and cytochrome c dyes. The images on each row were captured from the same field. The CAOV-3 cells exhibited a reduction in cell number and MMP, whereas the cells treated with pulvhrin A at 24 h (20× magnification) showed increases in cell permeability and cytochrome c release. Histogram represents average intensities observed simultaneously in CAOV-3 cells in a concentration-dependent manner for total nuclear intensity, cell permeability, MMP and cytochrome c release. All data were determined as mean ± SD in which the significant difference was expressed as *p< 0.05.
