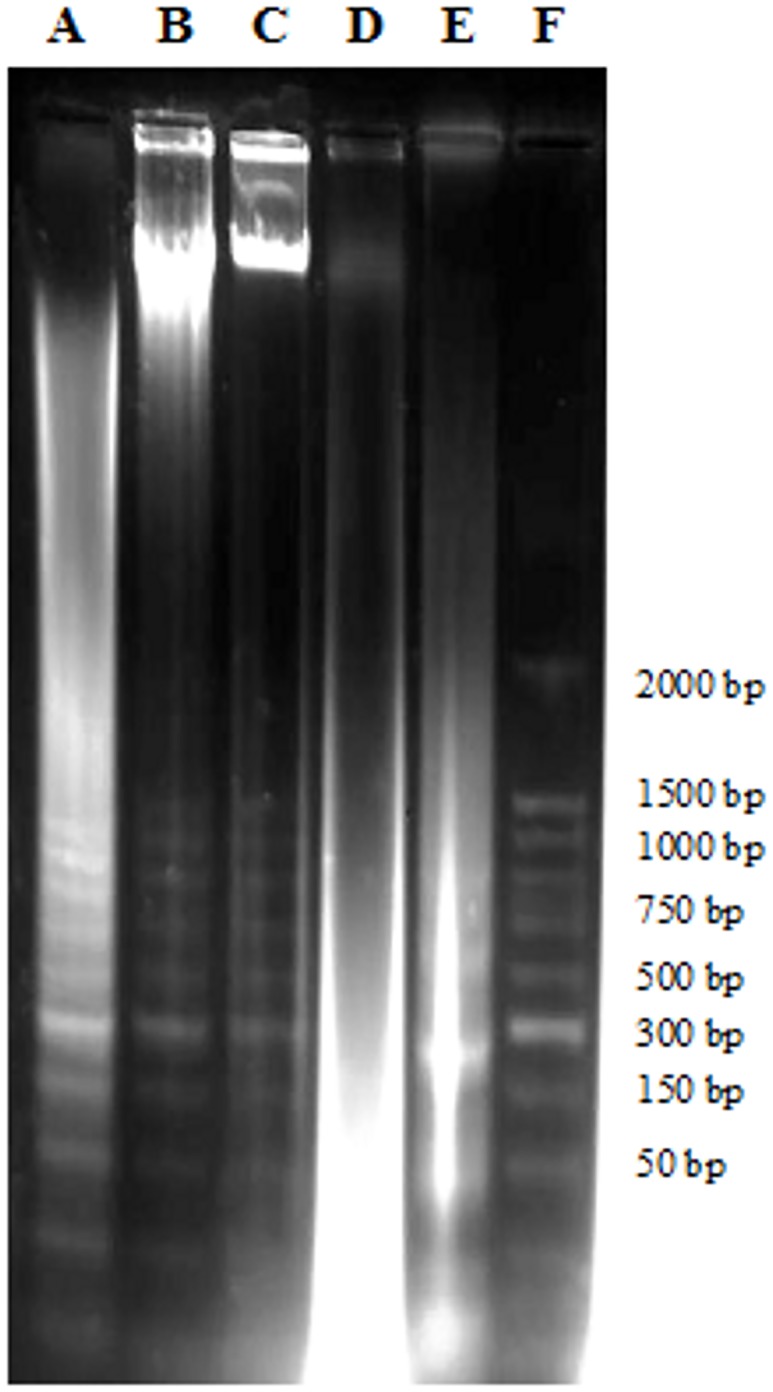
Fig 7. DNA fragmentation of untreated and treated CAOV-3 cells with pulchrin A (22 μM) by electrophoretic separation.

Lanes A-C: cells treated with pulchrin A for 72, 48 and 24 h, respectively. Lane D: untreated cells. Lane E: positive control of treated-HL-60 cells with actinomycin D. Lane F: DNA marker (50 base pair).
