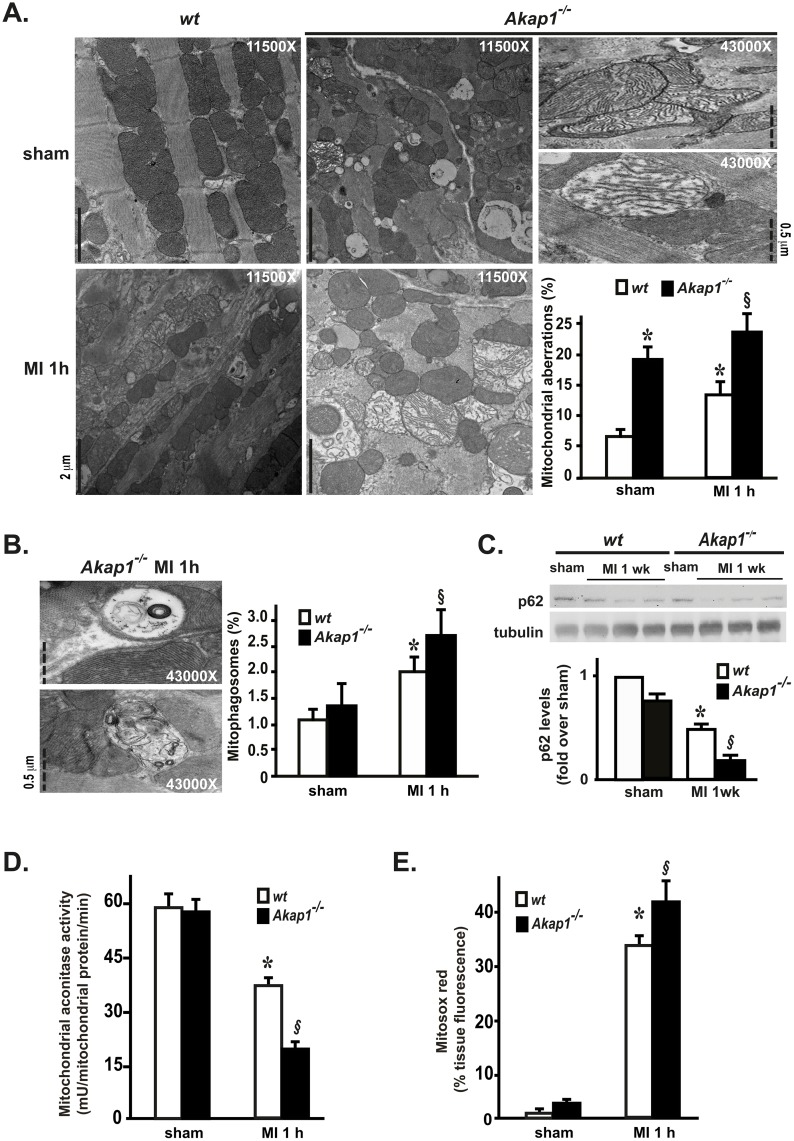
Fig 3. Akap1 genetic deletion promotes mitochondrial dysfunction and enhances mitophagy after myocardial infarction.
(A) Representative electron microscopy images of mitochondria in cardiac sections from wt or Akap1-/- mice after the sham procedure or one hour of permanent coronary artery ligation (MI 1h) and bar graphs showing cumulative data of multiple independent experiments to quantify % mitochondrial aberrations (n = 3 hearts/group; scale bars and magnifications are reported in the single panels; *p<0.05 vs. wt sham; §p<0.05 vs. wt MI). (B) Left: Representative electron microscopy images of mitophagosomes observed in Akap1-/- MI 1h mice. Magnifications and scale bars are reported in the single panels. Right: Bar graphs showing quantitative data on % mitophagosomes observed in wt or Akap1-/- after the sham or MI 1h procedures (*p<0.05 vs. sham; §p<0.05 vs. wt MI). (C) Representative immunoblot and densitometric analysis of 4 independent experiments to evaluate p62 protein levels in wt and Akap1-/- mice after the sham or MI 1wk procedures. Tubulin protein levels did not significantly change among the samples (*p<0.05 vs. sham; §p<0.05 vs. wt MI; n = 6 hearts/group). (D) Bar graphs showing cumulative data of multiple independent experiments measuring mitochondrial aconitase activity in wt or Akap1-/- cardiac mitochondria after the sham or MI 1h procedures (*p<0.05 vs. sham; §p<0.05 vs. wt MI; n = 4 hearts/group). (E) Bar graphs showing cumulative data of multiple independent experiments to assess mitochondrial ROS generation in wt or Akap1-/- heart sections after the sham or MI 1h procedures (*p<0.05 vs. sham; §p<0.05 vs. wt MI 1h; n = 4 hearts/group).

