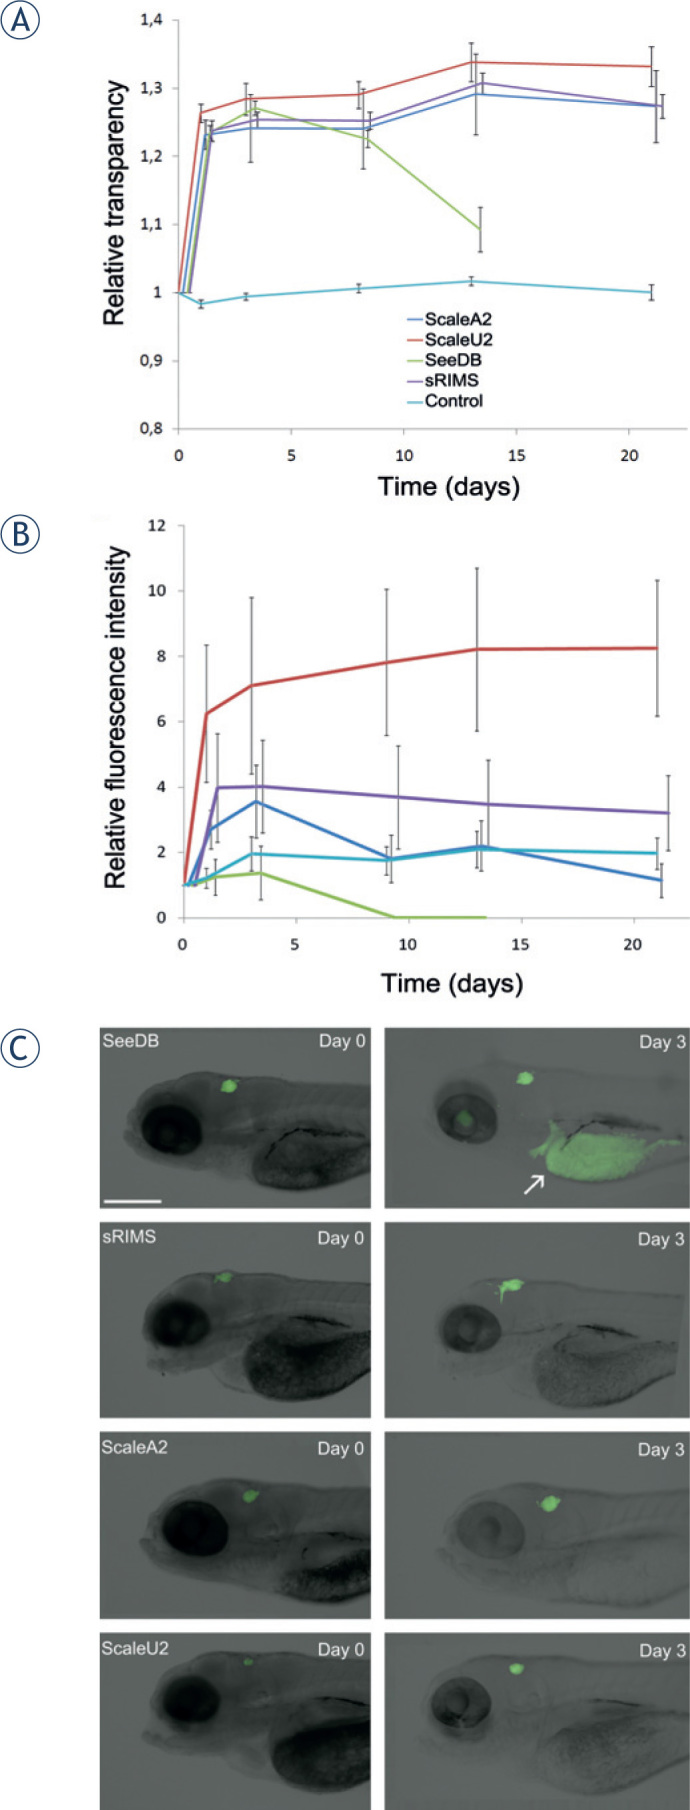
Figure 1.

(A) Clearing of zebrafish embryos. Embryos were fixed 3 days after fertilization, exposed to the different clearing agents SeeDB, sRIMS, ScaleA2, and ScaleU2 for 21 days, and imaged regularly. Time courses of changes in relative transparency are shown, which represents the value of integrated density relative to day 0 divided by the embryo area relative to day 0. Differences between treatments are statistically significant in all cases except between ScaleA2 and Scale B2 (on all days) and between ScaleA2 and sRIMS on day 21. Green, SeeDB; purple, sRIMS; dark blue, ScaleA2; red, ScaleU2; light blue, PBS control. Data for the different clearing agents are displaced horizontally for improved clarity. Means ± SE of eight embryos per treatment are shown. (B) Preservation of GFP fluorescence during clearing. Changes in the detected GFP fluorescence intensity of glioblastoma cells implanted in the brain of zebrafish embryos during treatment with different clearing agents of SeeDB, sRIMS, ScaleA2, and ScaleU2, measured over 21 days of the treatment. The integrated density of GFP-expressing cells relative to day 0 was measured. Fluorescence intensity was significantly increased compared to control in the case of ScaleU2 on all days except on day 3, but not in the case of other clearing agents. Means ±SE of 24 embryos per treatment are shown. (C) Fluorescence of U373-GFP cells in the brain of zebrafish embryos. Representative images show embryos treated with the different clearing agents obtained at the beginning of observation (Day 0, left) and after 3 days of clearing (Day 3, right). The appearance of autofluorescence of the yolk (arrow) is evident in the case of SeeDB. Scale bar: 400 μm.
