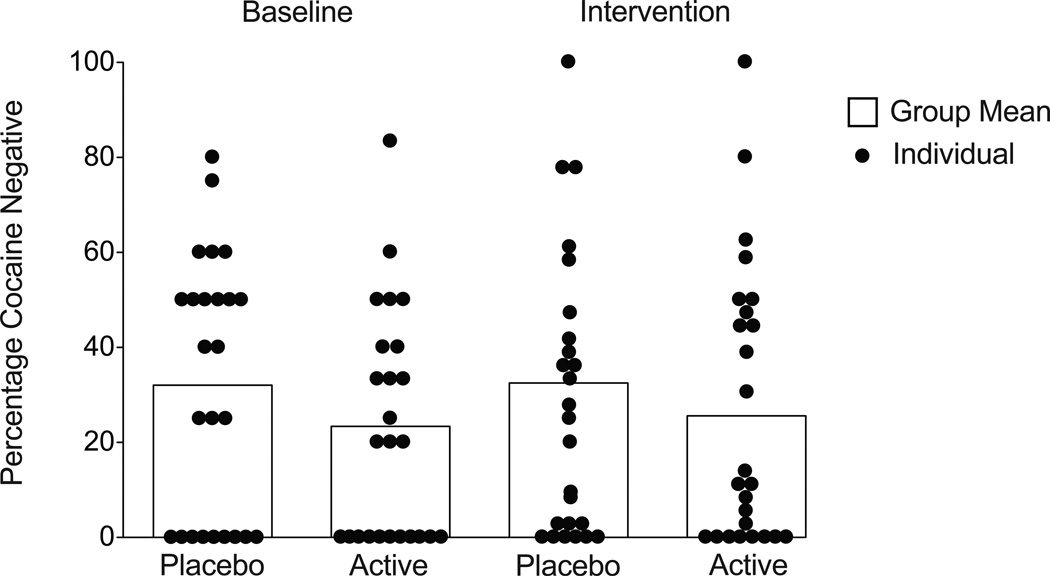
Figure 3.
The figure illustrates benzoylecgonine negative urine samples provided during the 2-week screening period (left side) and during the 12-week intervention period (right side). The histogram illustrates the mean number of benzoylecgonine negative urines for the two groups, and the circles represent the data for each individual subject. There were no significant differences between the groups with respect to provision of negative urine samples during the baseline period, and the intervention with atomoxetine treatment did not alter this pattern.

