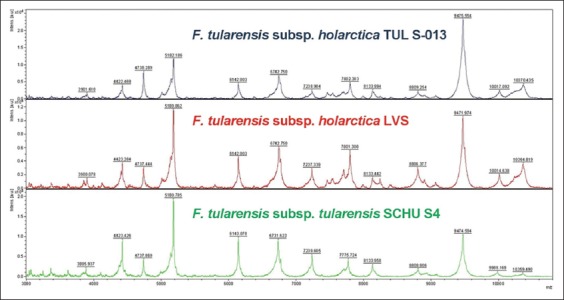
FIGURE 3.

Spectral profiles obtained by Bruker MALDI-TOF MS for the clinical F. tularensis subsp. holarctica isolate TUL S-013 (top) and the reference strains F. tularensis subsp. holarctica LVS (middle) and F. tularensis subsp. tularensis SCHU S4 (bottom). All mass spectra were smoothed, baseline corrected and intensity normalized.
