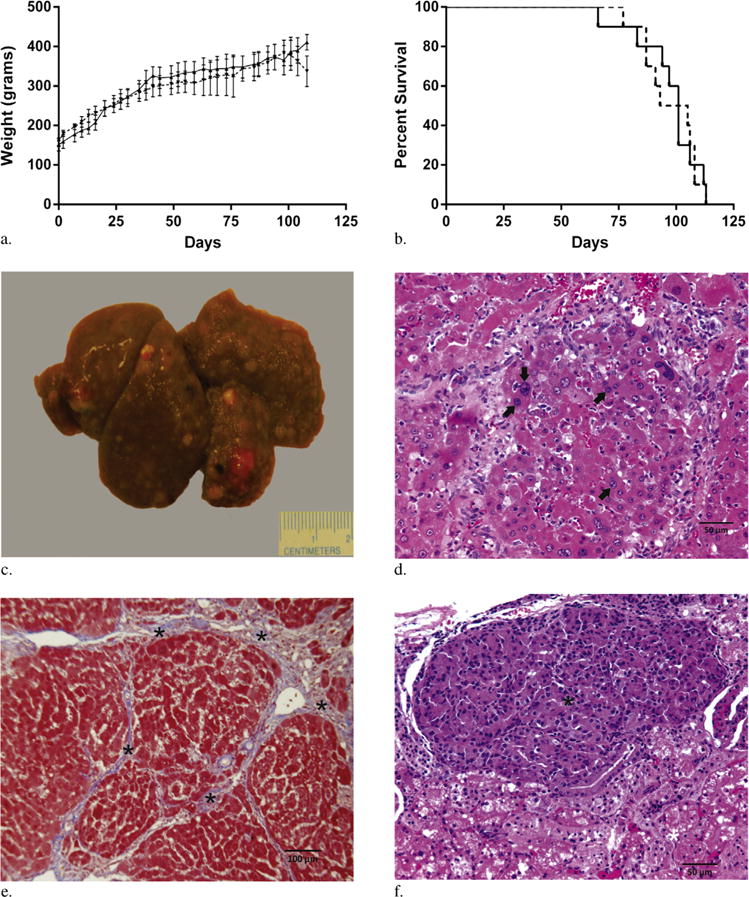
Figure 1.

(a) Plots of weight gain after DEN administration (group 1, ––; group 2 – –). (b) Kaplan-Meier curves after DEN administration (group 1, ––; group 2 – –). (c) Representative gross liver specimen 3 weeks after cessation of DEN administration demonstrating a nodular liver with numerous HCCs. (d) HCCs were confirmed on histology with H&E demonstrating nuclear atypia (arrows). (e) Trichrome staining demonstrated hepatic fibrosis consistent with cirrhosis (asterisks). (f) H&E staining of renal metastasis (black asterisk) with adjacent normal renal parenchyma (white asterisk) from DEN-treated rat.
