
Figure 3.
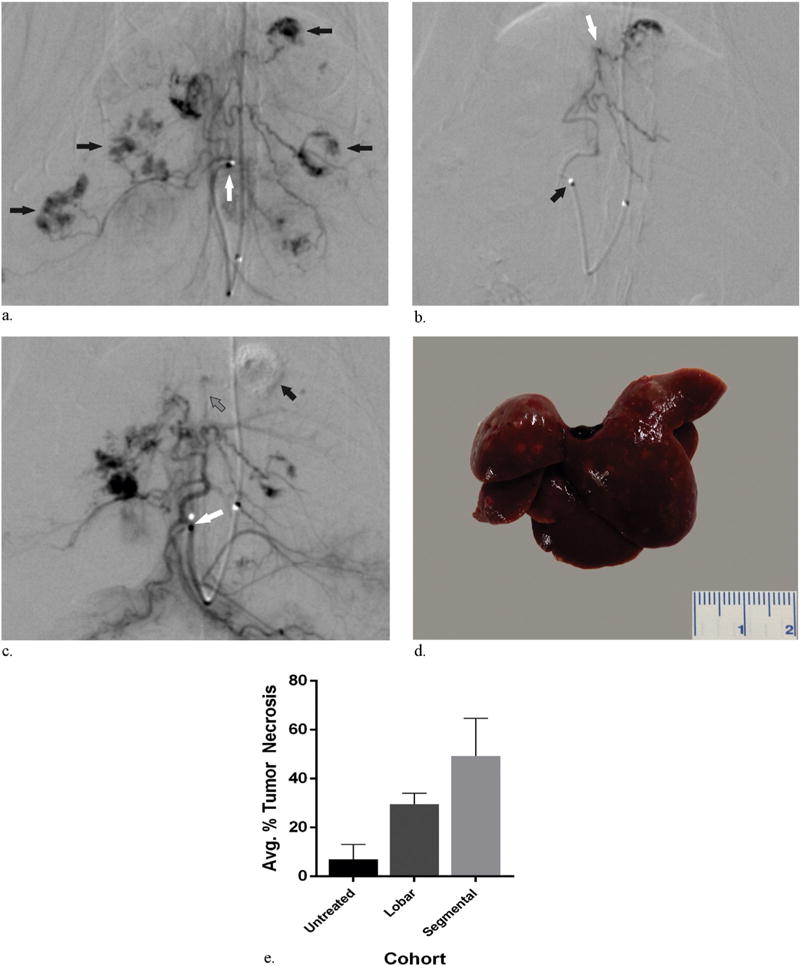
(a) Representative arteriogram demonstrating the tip of the catheter within the proper hepatic artery (white arrow) and tumor staining (black arrows) within the liver. (b) Representative arteriogram obtained before embolization demonstrating catheter tip within the proper hepatic artery (black arrow) and the microcatheter tip within a second-order branch of the left hepatic artery (white arrow). (c) Representative pull-back arteriogram obtained after embolization demonstrating the catheter tip within the proper hepatic artery (white arrow) with superselective vascular pruning and exclusion of the tumor feeding vessel (gray arrow) and the distal tumor within the left hepatic lobe (black arrow). (d) Representative explanted liver 24 hours after superselective embolization without findings of nontarget embolization. (e) Bar graph of average percent tumor necrosis in untreated rats and rats treated with lobar and segmental embolization demonstrating an expected significant increase in average tumor necrosis for rats treated with segmental embolization relative to lobar embolization (P = .0029).