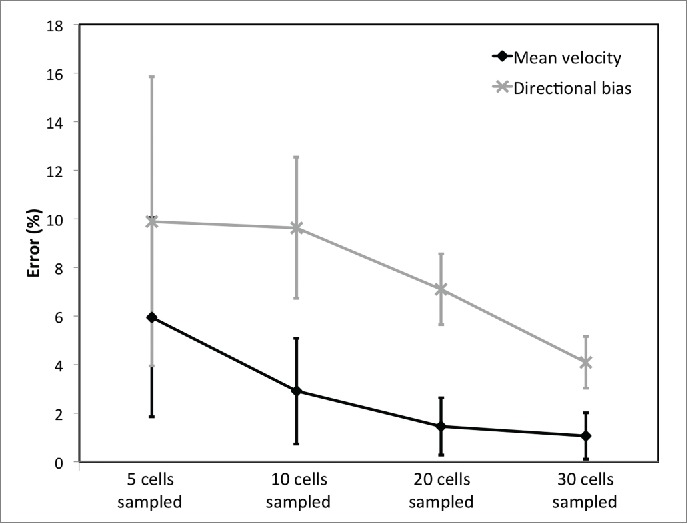
Figure 3.

The error in cell migration metrics when subpopulations of cells (5, 10, 20 and 30 per sequence) are sampled compared with an analysis of the trajectories of every imaged cell (40-80 per sequence). To sample cells, they were selected at random from each of 5 image sequences and 1) the mean cell velocity (displacement per time step/time between frames) and 2) directional bias with the flow (velocity of cells moving between 90° and 270° divided by overall cell velocity) were calculated. Subpopulation sampling was repeated 10 times with different randomly selected cells to provide a mean error and standard deviation of error from the ‘gold standard’ case where all cells were analyzed. Error bars on individual data points represent variation in results as a result of the choice of sampled cells. Data are presented for isolated SGHPL-4 cultured in isolation under 6 dyne/cm2 shear but hold for other cultures analyzed.
