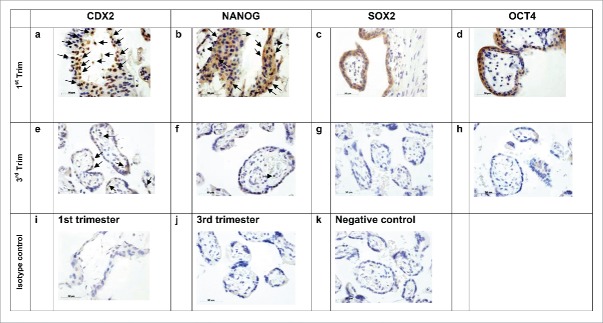
Figure 1.
IHC 1st vs. 3rd Trimester, villous sections. Diagonal arrows (↘) indicate marker staining within the cytotrophoblast layer of the villous. Horizontal arrows (←, →) indicate marker staining in cells within the mesenchymal core of the villous. All investigated markers are expressed within the villous of 1st trimester placentas (a-d). Especially CDX2 (a) and NANOG (b) appear to be expressed in the cytotrophoblast and villous mesenchymal core cell populations, while OCT4A (c) and SOX2 (d) appear to be expressed mainly in the cytoplasm of the syncytiotrophobast. Expression of all markers is markedly decreased (CDX2 and NANOG in e and f respectively) or lost (OCT4A and SOX2 in g and h respectively) in the villous of healthy placentas. Scale bars indicate 50 µm.

