
Figure 3.
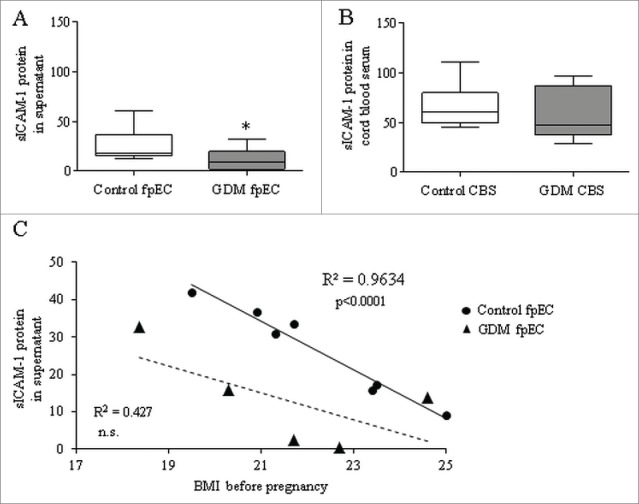
sICAM-1 in culture supernatant of control and GDM feto-placental endothelial cells and in cord blood serum. Levels of sICAM-1 quantified by ELISA showed significant reduction in supernatant of GDM vs control fpEC (A) (n control/GDM=11/6). In cord blood serum (CBS) collected after healthy (control CBS) and GDM pregnancies (GDM CBS) sICAM-1 levels were similar (B) (n control/GDM=12/17). Correlation of sICAM-1 levels released in the supernatant of fpEC isolated after normal pregnancies (circles) and GDM pregnancy (triangles) with maternal BMI before pregnancy. The linear regression line is given as continuous line for the controls and as dached line for the GDM derived fpEC. (C) *p<0.05.