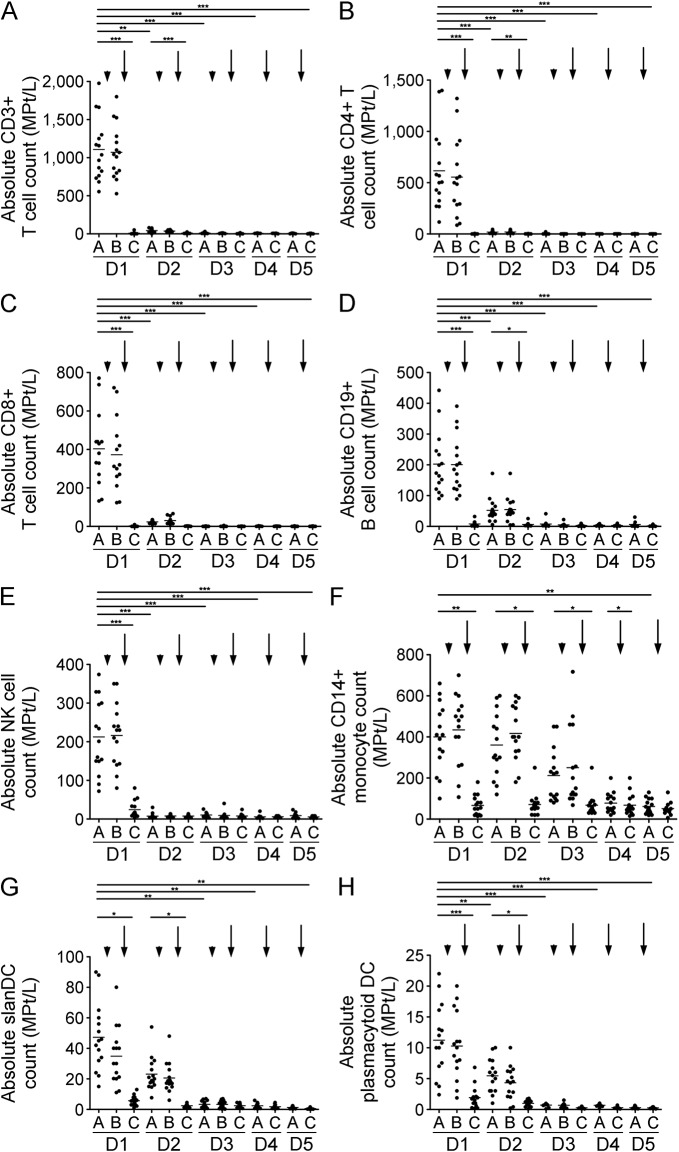
Figure 4. Cell count of selective immune cell subpopulations during alemtuzumab.
Absolute cell count of CD3+ T cells (A), CD4+ T cells (B), CD8+ T cells (C), CD19+ B cells (D), natural killer (NK) cells (E), CD14+ monocytes (F), slanDC (G), and plasmacytoid DC (H) are depicted. Analysis was performed before infusions started (A), after methylprednisolone (B), and after alemtuzumab (C) on each of the 5 infusion days (day 1–day 5 [D1–D5]). Arrowhead indicates administration of methylprednisolone, arrow indicates administration of alemtuzumab. Horizontal bars show mean values. Asterisks indicate a statistically significant difference (*p < 0.05, **p < 0.01, ***p < 0.001).

