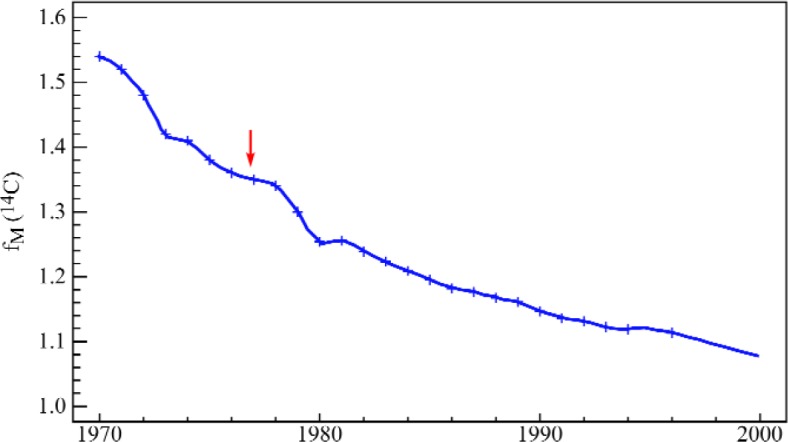
Fig. 11.

Short term 14C “decay” curve, representing geochemical relaxation of excess atmospheric 14C from nuclear testing [Levin et al., in (Ref. [19]; Ref. [20], Chap. 31). Information critical for the discussion in Sec. 7.2.1 is indicated by the arrow—namely, the sampling date and corresponding biomass 14C enrichment for SRM 1649a (urban dust).
