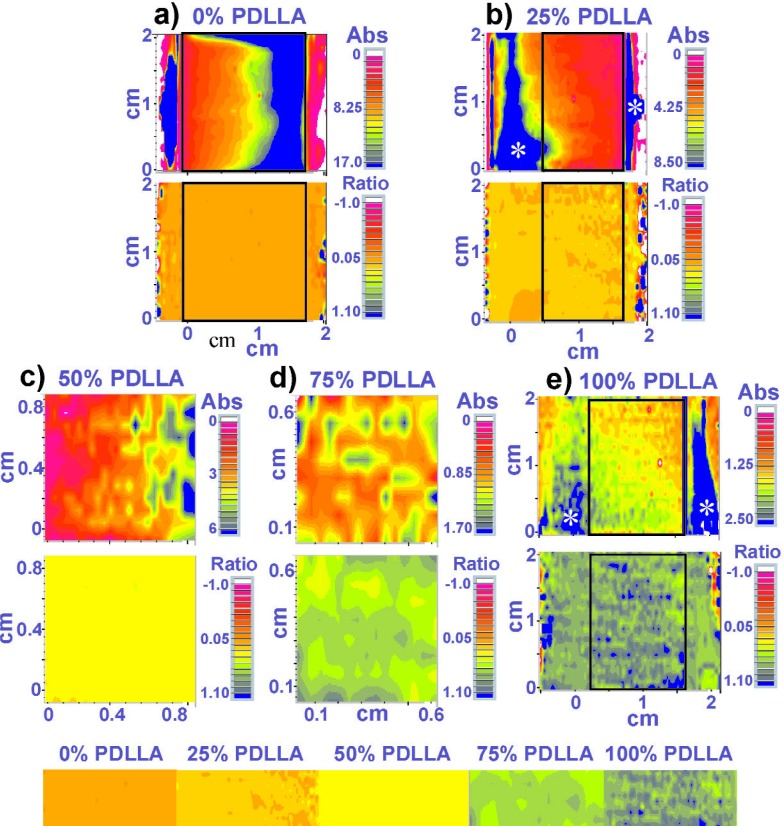
Fig. 2.
Absorbance (top) and ratio (bottom) maps of five discrete composition films. For the absorbance maps, blue indicates the highest absorbance and pink represents the lowest. The absorbance of the 0 % PDLLA film is higher than that of 100 % PDLLA film, which indicates that the 0 % PDLLA film is thicker than the 100 % PDLLA film. Note that the color range of the absorbance maps of discrete blends containing higher % PLLA is larger, which is an indication of thicker films. For the ratio maps, orange indicates the highest % PLLA and blue indicates the highest % PDLLA. White stars on the blue regions in the absorbance maps indicate thicker regions. Note that the absorbance and ratio maps in panel 2e appear also in Fig 3a. The color bar in the bottom was assembled from the middle parts of the ratio maps of the discrete composition films.

