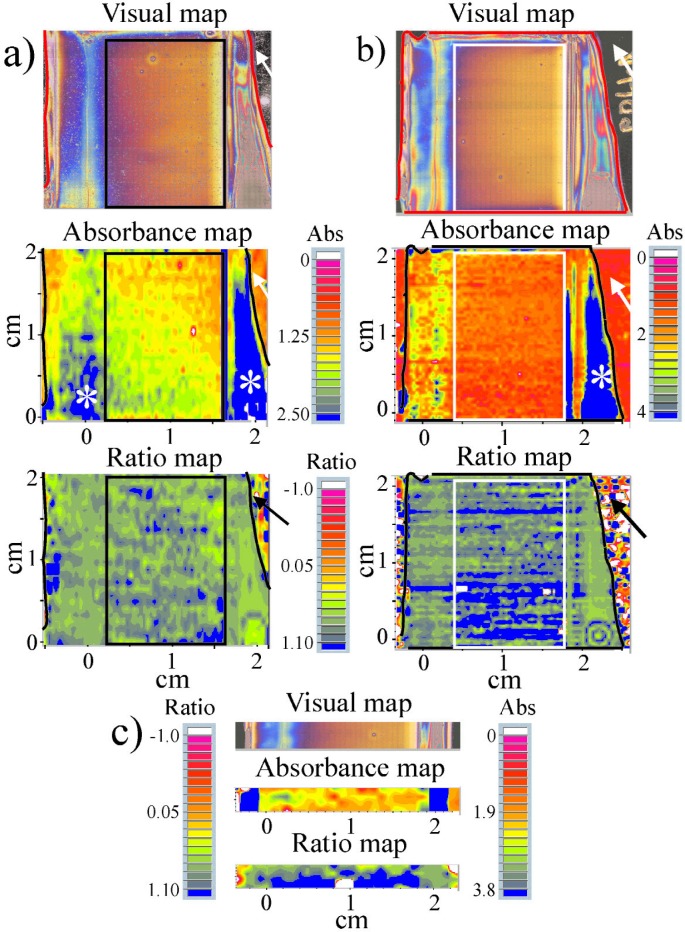
Fig. 3.
Visual, absorbance, and ratio maps of three 100 % PDLLA films. Only the middle of film #3 was mapped (panel c). The arrows (panels a and b) point to bare regions of the slide that are not covered with polymer film. The colors in these bare areas seen in the ratio maps are artifacts of ratioing spectra of the reflective glass substrate. White stars on the blue regions in the absorbance maps indicate thicker regions.

