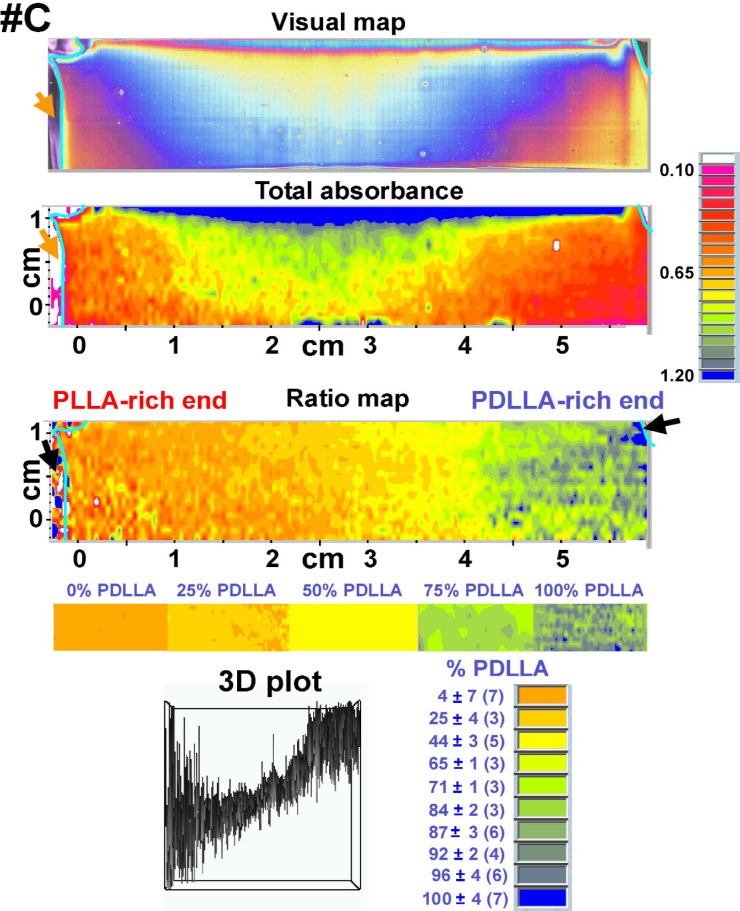
Fig. 7.
Visual map, total absorbance map (1500 cm−1 to 1155 cm−1 spectral region), ratio map (peak area at 1270 cm−1)/(peak area at 1450 cm−1) and 3D plot (arbitrary units) of PLLA-PDLLA composition gradient #C. The arrows on the visual and FTIR maps point to bare regions of the slide that are not covered with polymer film. The colors in these bare areas seen in the ratio maps are artifacts of ratioing spectra of the reflective glass substrate. The color bar, shown below the ratio map, was assembled from the middle parts of the ratio maps of the discrete composition films. The averages and standard deviations of the % PDLLA in the color code (bottom right panel) were calculated with the calibration curve. Numbers of spectra in each color group appear in parenthesis.

