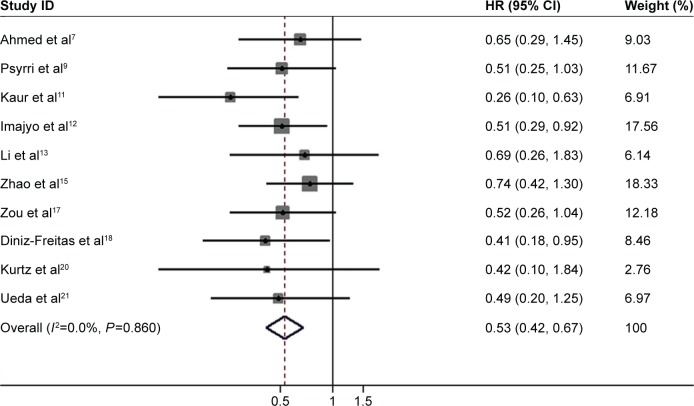
Figure 3.
A forest plot for overall survival.
Note: The difference between the high E-cadherin group and the low E-cadherin group was significant (HR =0.53; 95% CI =0.42, 0.67; P=0.000) and the heterogeneity was acceptable (I2=0.0%, P=0.860).
Abbreviations: HR, hazard ratio; CI, confidence interval.

