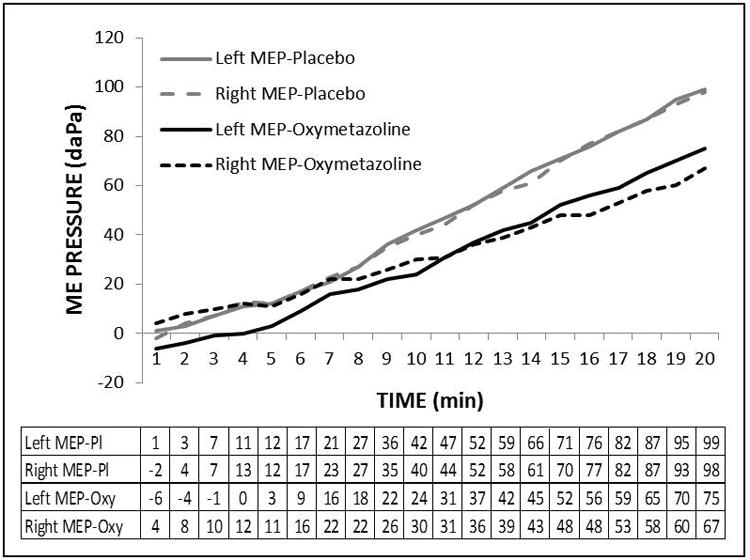
Figure 2.

Example ME pressure-time functions for the left (solid lines) and right (broken lines) ears of Subject 6408 recorded during the placebo (gray line) and active (black line) treatment sessions and the tabulated source data for time (min.) and ME pressure (daPa). Note that the lines for the two ears at both sessions were parallel indicating similar slopes and that slopes of the lines for the active treatment were more shallow than those for the placebo treatment. Also, note that each line consisted of a series of roughly parallel, linear segments of positive slope interrupted by discrete displacements in the direction of 0 daPa pressure indicative of a pressure-regulating ET opening. The slope used in the analysis was extracted from the longest linear segment for each function by linear regression.
