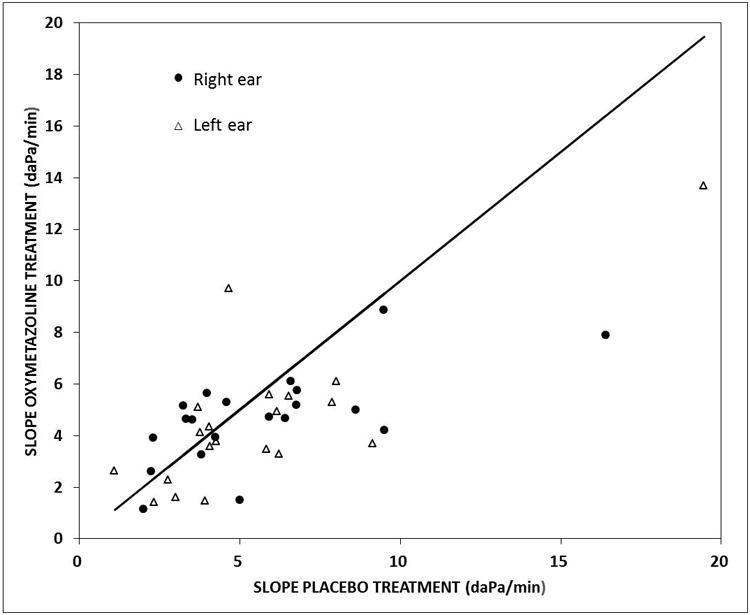
Figure 3.

Scatterplot of the ME Pressure-Time slopes recorded after oxymetazoline treatment as a function of the paired slopes recorded after the placebo treatment for Right (solid circles) and Left (open triangles) ears. The solid line is the line of identity for the placebo slopes.
