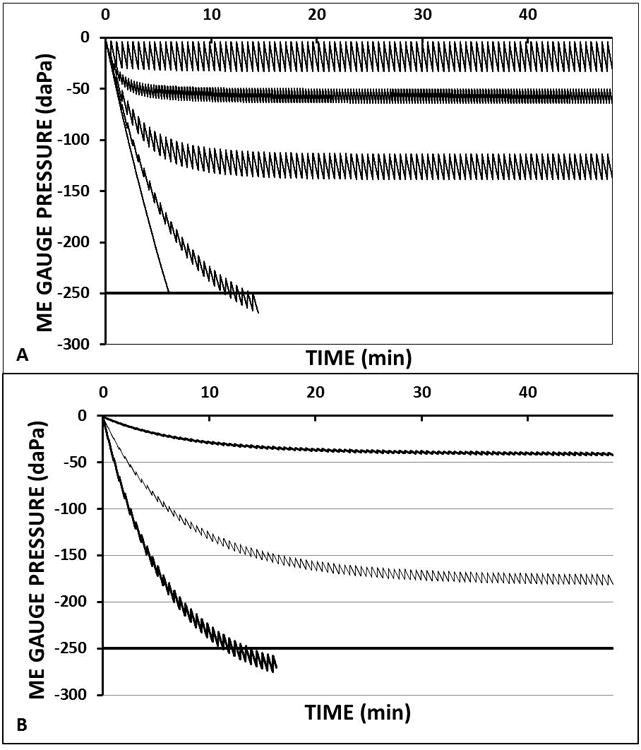
Figure 4.

Time trajectories for the middle-ear gauge pressures predicted by a standard mathematical model of middle-ear pressure regulation1 while holding most parameters constant but varying (A) the ET opening efficiency measured as the fractional gradient (FGE=1.0, 0.5, 0.2, 0.07 and 0.0 from least to greatest exponential slopes) at a fixed ET opening frequency of 1/30 minutes and mucosal perfusion rate of 1 mucosal blood volume replaced per second (Q=1) and (B) varying mucosal perfusion represented by the number of mucosal blood volumes replaced in 1 second (Q=1, Q=0.5, Q=0.01 from greatest to least exponential slopes) at a fixed FGE of 0.07 and ET opening frequency of 1/30 minutes. Solid horizontal line at -250 daPa defines the critical middle-ear gauge pressure for the development of mucosal inflammation and effusion. For all simulations, fixed constants were taken from the literature for blood and for the tissue (water), middle ear volume was set to 5 ml and the mucosal surface area was calculated from the measured surface area/volume ratio for the tympanum and mastoid of 1626.
