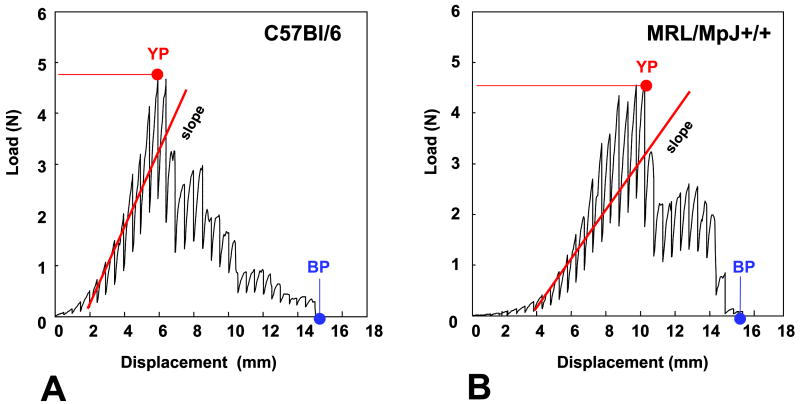
Figure 1. Load-displacement curves of the uterine cervix.
Representative load-displacement curves are shown for C57Bl/6 (Panel A) and MRL/MpJ+/+ (Panel B) at 3 days postpartum. The mid-slope of the regression lines of the linear ascending part of the curve (elastic phase) (shown in red) is a measure of material stiffness. The yield point (YP: moment when tissue changes its proprieties from elastic to plastic) and break point (BP: moment when tissue is physically disrupted) are indicated with arrows.

