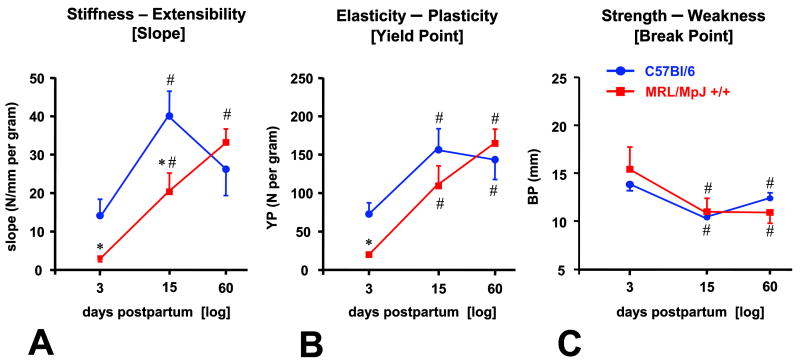
Figure 3.
Analysis of the load-displacement relationships of cervices from day 3, 15 and 60 post-delivery demonstrating differences in the slope (Panel A: measure of stiffness), yield point (Panel B: measure of plasticity) and break point (Panel C: measure of strength). Statistical analysis: 2-way ANOVA followed by post-hoc Student-Newman-Keuls tests. * P<0.05 vs C57Bl/6; # P<0.05 vs. day 3 post-delivery of the same strain.

