Fig. 2.

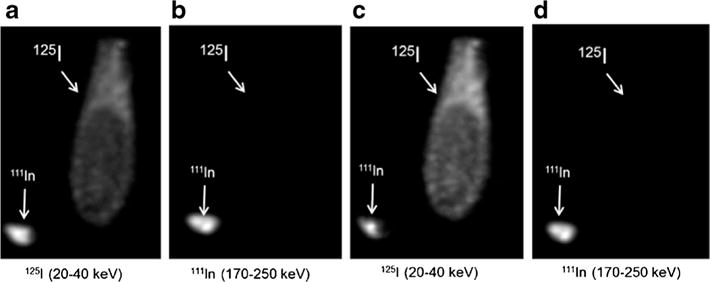
Vials containing either 125I or 111In were scanned with SPECT/CT. Raw (a, b) and unmixed (c, d) images were constructed from signals collected in two energy windows (20–40 keV and 170–250 keV).

Vials containing either 125I or 111In were scanned with SPECT/CT. Raw (a, b) and unmixed (c, d) images were constructed from signals collected in two energy windows (20–40 keV and 170–250 keV).