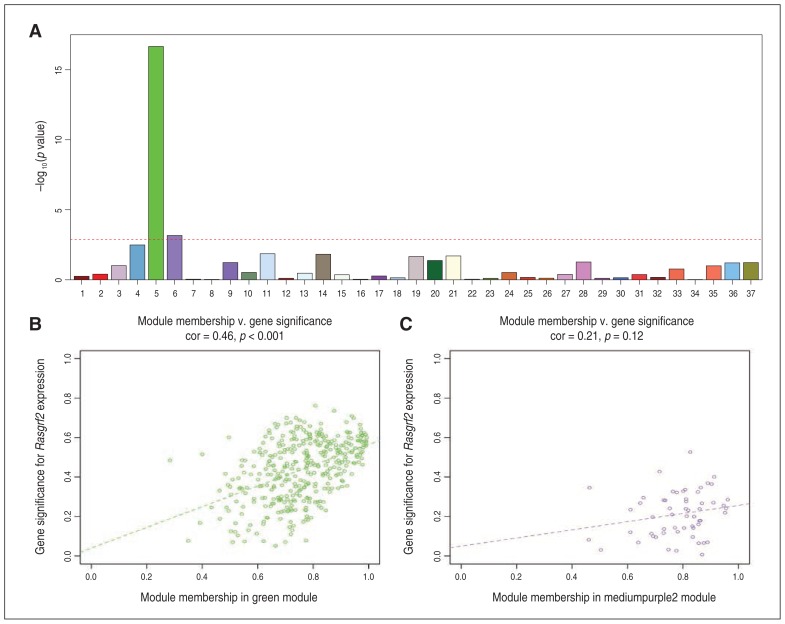
Fig. 1.
Identifying gene coexpression modules associated with knockout (KO) status. (A) Association of each module’s eigengene with the KO status. The Y axis indicates the –log10 of the association p value. The dotted red line represents the significance level at p < 0.001 after Bonferroni correction. (B, C) Correlations between gene significance (i.e., correlation with Rasgrf2 gene expression levels) and module membership for (B) M5 and (C) M6 modules. Colour-coding is equivalent to module names (green and medium purple).

