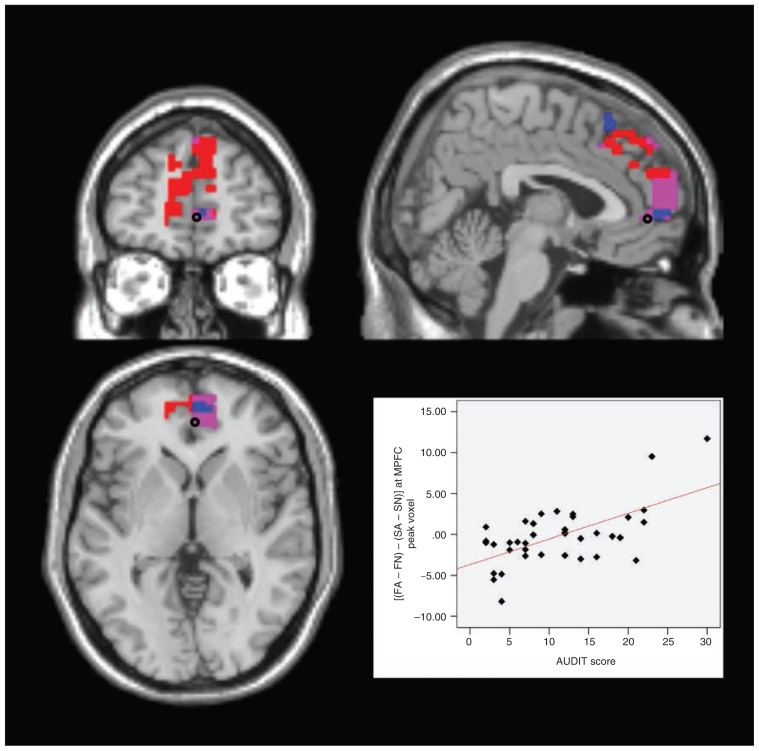
Fig. 3.
Failed self-control in alcohol trials — medial prefrontal cortex (MPFC). Section views showing significant clusters for AUDIT × (FA − FN) and AUDIT × [(FA − FN) − (SA − SN)] within the MPFC at a threshold of p < 0.05, family-wise error–corrected. Custers are presented at a threshold of p < 0.005, uncorrected. Red: MPFC cluster with higher activity in participants with higher drinking severity in failed self-control in alcohol compared with nonalcohol trials (AUDIT × [FA − FN]) Blue: MPFC cluster with higher activity in participants with higher drinking severity in failed compared with successful self-control in alcohol compared with nonalcohol trials (AUDIT × [(FA − FN) − (SA − SN)]) Violet: overlap between these 2 clusters. Plot: effect of interaction contrast (FA − FN) − (SA − SN) at the marked peak voxel (Montreal Neurological Institute space: x, y, z = 4, 49, 0) plotted subject-wise against AUDIT score. AUDIT = Alcohol Use Disorders Identification Test; FA = failed self-control in an alcohol–nonalcohol conflict; FN = failed self-control in a nonalcohol–nonalcohol conflict; SA = successful self-control in an alcohol–non-alcohol conflict; SN = successful self-control in a nonalcohol–nonalcohol conflict.

