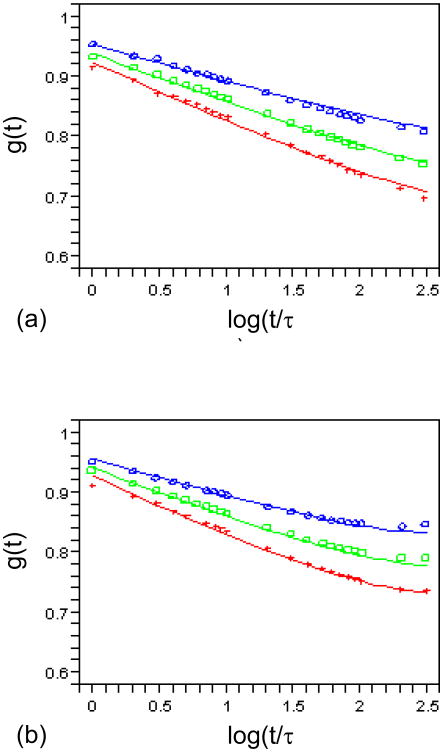
Fig. 4.
The reduced relaxation function g(t) of the linear model (curves) compared with experimental data (symbols) in [1]. (a) m = 6 and τ= 400.0 s fitted to canine aortic arch. (b) m = 5 and τ= 120.0 s fitted to canine proximal thoracic artery. β= 0.038, 0.052, 0.065 from top to bottom. ρ= 3.6 and τ0 = 1.0 sec.

