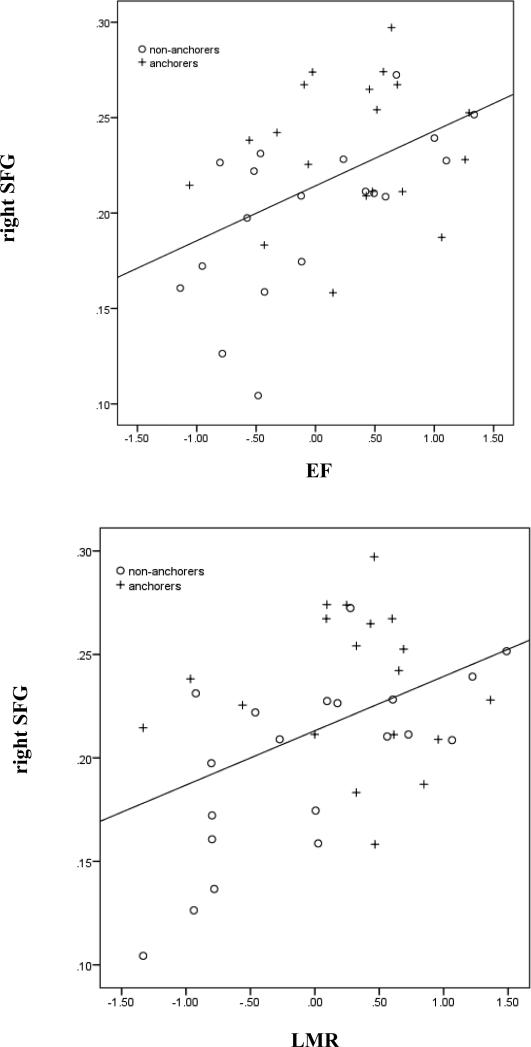
Figure 1.
Scatterplots with trend lines of 2-tailed correlations between local efficiency metrics within the right superior frontal gyrus (rightSFG) and composite z-scores of executive functioning (EF; r(38)=.47, p=.003) and learning/memory/recognition (LMR; r(39)=.45, p=.005) stratified by group (anchorers labeled ‘+’; non-anchorers labeled ‘o’).

