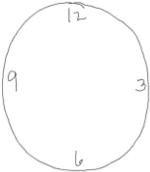
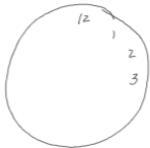
Table 1.
Sample Characteristics

|

|
||
|---|---|---|---|
| dCDT & COGNITIVE SAMPLE | Anchorers n=36 | Non-Anchorers n=35 | Statistics |
| Age (years) | 66.75±5.73 | 66.94±7.20 | F(1,69)=0.01, p=.90 |
| Sex (M:F) | 12 : 24 | 18 : 17 | x2=2.38, p=.12 |
| Race (white:nonwhite) | 22 : 14 | 20 : 15 | x2=0.11, p=.73 |
| Handedness (R:L:mixed) | 32 : 4 : 0 | 31 : 2 : 2 | x2=2.66, p=.26 |
| Education (years) | 15.75±2.61 | 14.60±3.09 | F(1,69)=2.87, p=.09 |
| Mini-Mental State Examination | 28.89±1.25 | 28.70±1.43 | F(1,68)=0.38, p=.53 |
| predicted verbal IQ | 108.44±13.08 | 105.74±15.12 | F(1,69)=0.65, p=.42 |
| Hamilton Depression Rating Scale | 1.42±1.66 | 1.80±1.66 | F(1,69)=0.94, p=.33 |
| Center for Epidemiologic Studies of Depression | 5.50±4.76 | 7.31±5.40 | F(1,69)=2.26, p=.13 |
| WMS-III Visual Reproduction Copy | 95.80±5.27 | 93.60±6.26 | F(1,69)=2.58, p=.11 |
| Type 2 Diabetes (healthy:diabetes) | 21:15 | 17:18 | x2=0.68, p=.41 |
| Diabetes Duration (months) | 37.34±67.75 | 59.22±75.57 | F(1,69)=1.62, p=.20 |
| hemoglobin A1c | 6.20±0.80 | 6.51±1.22 | F(1,69)=1.49, p=.22 |
| CONNECTOMICS SAMPLE | Anchorers n=22 | Non-Anchorers n=21 | Statistics |
|---|---|---|---|
| Age (years) | 68.05±5.88 | 65.52±5.06 | F(1,41)=2.26, p=.14 |
| Sex (M:F) | 6 : 16 | 10 : 11 | x2=1.90, p=.16 |
| Race (white:nonwhite) | 12 : 10 | 13 : 8 | x2=0.24, p=.62 |
| Handedness (R:L:mixed) | 20 : 2 : 0 | 18 : 2 : 1 | x2=1.08, p=.58 |
| Education (years) | 15.32±2.78 | 14.52±2.82 | F(1,41)=0.86, p=.35 |
| Mini-Mental State Examination | 28.95±1.21 | 29.05±1.07 | F(1,41)=0.07, p=.79 |
| predicted verbal IQ | 107.18±15.20 | 105.00±15.06 | F(1,41)=0.22, p=.64 |
| Hamilton Depression Rating Scale | 1.27±1.49 | 1.95±1.63 | F(1,41)=2.05, p=.16 |
| Center for Epidemiologic Studies of Depression | 5.00±4.89 | 6.43±5.18 | F(1,41)=0.86, p=.35 |
| Type 2 Diabetes (healthy:diabetes) | 15:7 | 9:12 | x2=2.79, p=.09 |
| hemoglobin A1c | 6.15±0.87 | 6.54±1.24 | F(1,41)=1.31, p=.26 |
| Diabetes Duration (months) | 34.72±68.87 | 63.86±78.40 | F(1,41)=1.68, p=.20 |
Note: There were no between-group differences in demographic variables.
