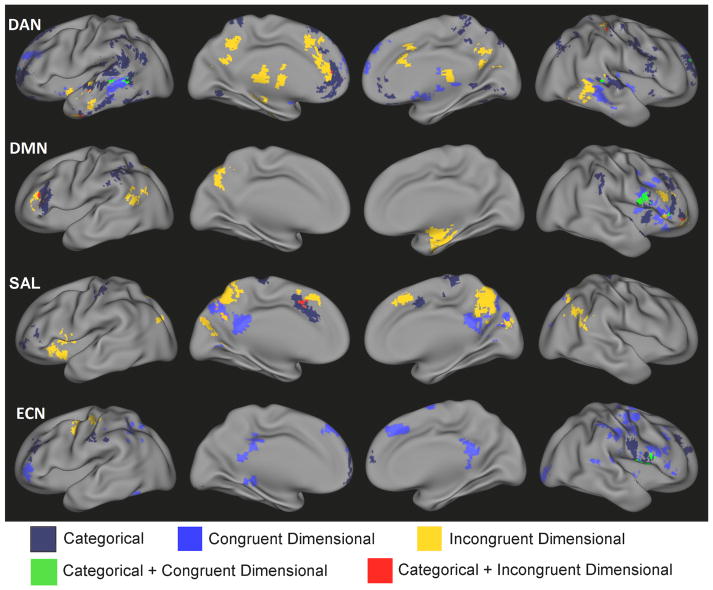
Figure 4.
Significant categorical-by-dimensional interaction effects of ASD for the dorsal attention network (DAN), default-mode network (DMN), salience network (SAL), and executive control network (ECN). Yellow indicates those regions for which the relationship between functional connectivity and symptoms was increased in slope (i.e., either become more positive or change from negative to positive) for ASD versus TDC, whereas blue indicates regions with a decrease in slope (i.e., either become more negative or change from positive to negative) relationship between functional connectivity and symptoms for ASD versus TDC.

