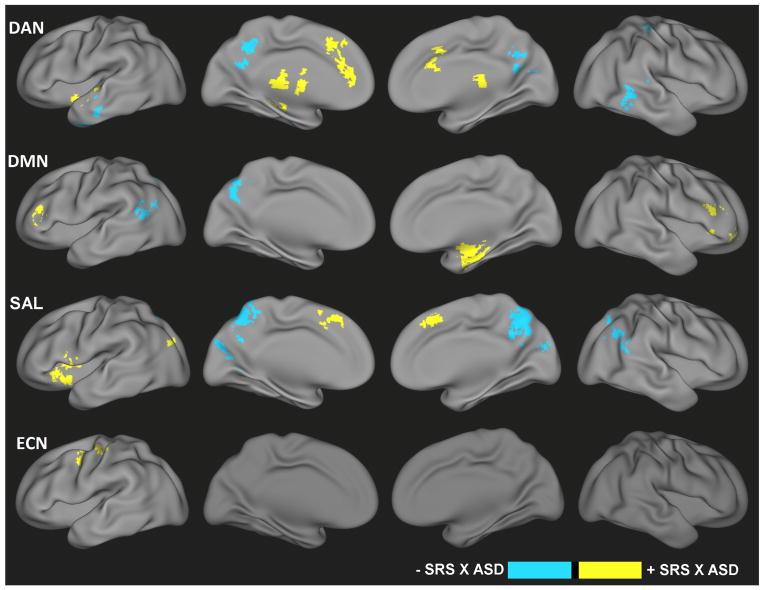
Figure 5.
Composite maps of the dorsal attention network (DAN), default-mode network (DMN), salience network (SAL), and executive control network (ECN) representing the regions demonstrating categorical effects of ASD on functional connecitivty (white), consistent dimensional relationships for both ASD and TDC (green), categorical differences in dimensional relationships between ASD and TDC (red), an overlap between categorical and congruent dimensional effects (blue) and an overlap between categorical and incongruent dimensional effects (yellow).

