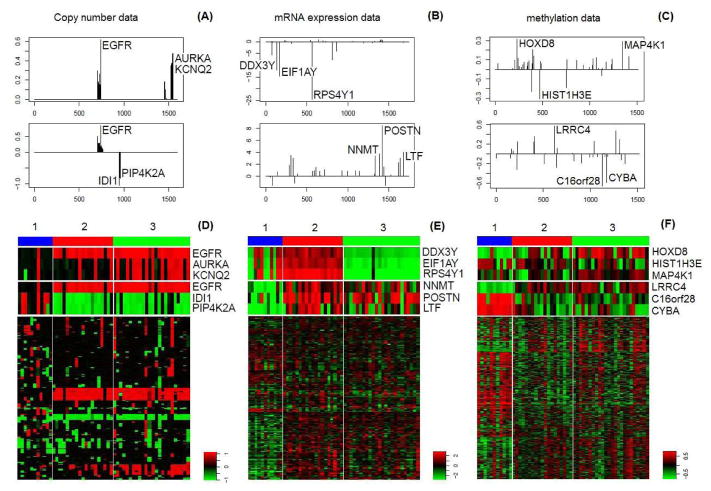
Figure 6.
(A–C) are plots of the first two integrative loadings of the DNA copy number data, the mRNA expression data and the methylation data respectively, where in each plot the top three genes are marked. (D–F) are heatmaps of the DNA copy number data, the mRNA expression data and the methylation data of the 55 GBM patients from TCGA respectively, where the columns (tumors) are arranged by clusters identified by irPCA. In particular, for each data type the heatmaps of the top three genes of the first two integrative loadings are plotted to explore relationships between these genes and the identified clusters.

