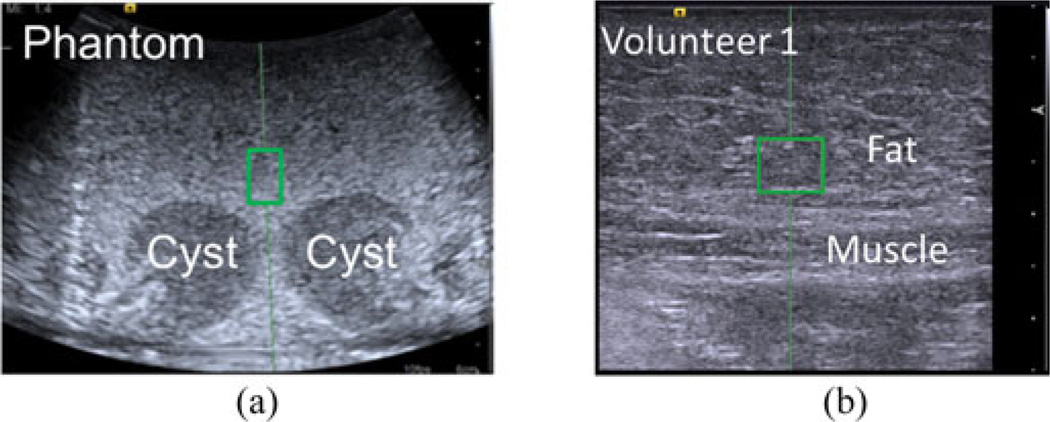
Fig. 4.
Screenshots from the ultrasound system with green rectangles demonstrating the location of shear wave speed ROIs in all images of the (a) phantom (relative to the two cyst-like structures) and (b) abdominal fat (relative to the fat-muscle boundary). The image depths were 6 and 3.5 cm, respectively, with the dots on the right of each image separated by 5 mm each to indicate the scale.

