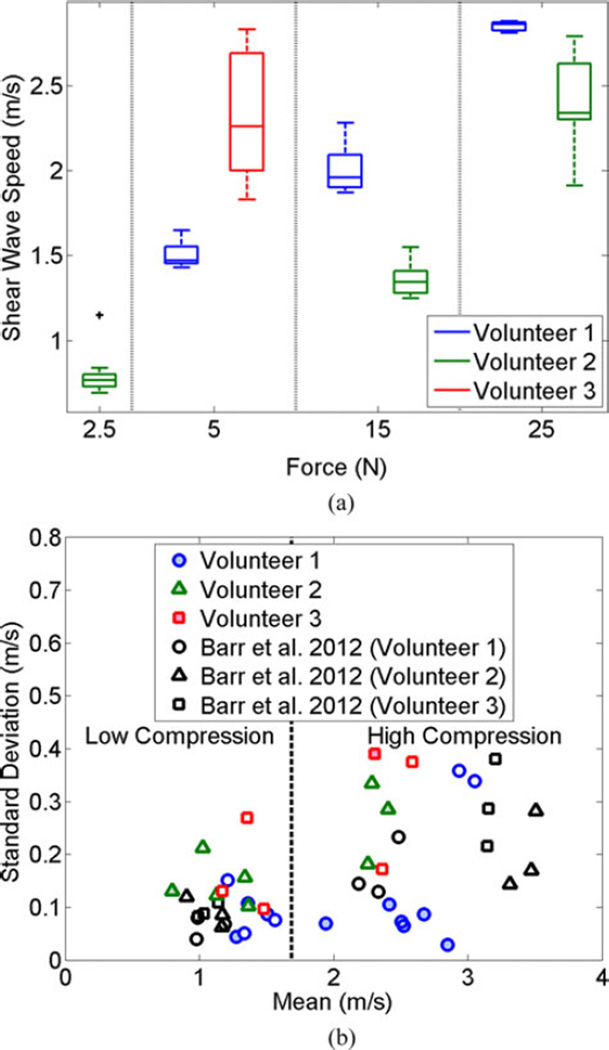
Fig. 7.
(a) Box-whisker plots showing the variability of shear wave speed measurements under robotic force control during breathhold. There is one outlier (+ symbol), defined as any value greater than 1.5 times the interquartile range. (b) Variability of our shear wave speed measurements acquired with cyclic motion (unfilled colored shapes) and a single breath hold (filled colored shapes) was compared to that of Barr and Zhang [18] who use a landmark-based approach to control tissue compression. The data are separated into two compression states (i.e., high and low) based on the external data [18], although not consistent for all instances of the data acquired with our robot.

