
Figure 2. Plasma levels of E2.
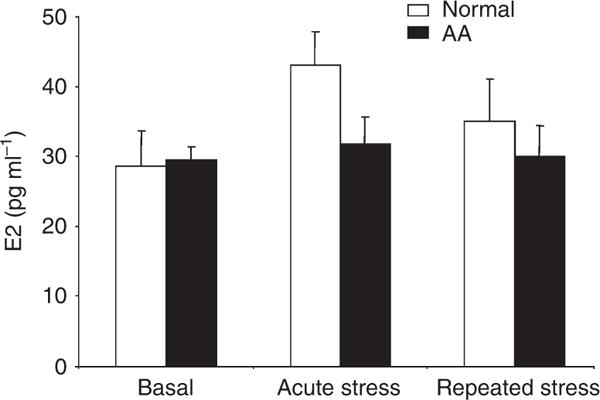
Plasma E2 levels were measured by RIA. Unfilled bars represent data from normal mice (n = 18) and black bars represent data from AA mice (n = 16).
Official websites use .gov
A
.gov website belongs to an official
government organization in the United States.
Secure .gov websites use HTTPS
A lock (
) or https:// means you've safely
connected to the .gov website. Share sensitive
information only on official, secure websites.
Plasma E2 levels were measured by RIA. Unfilled bars represent data from normal mice (n = 18) and black bars represent data from AA mice (n = 16).