
Figure 1.
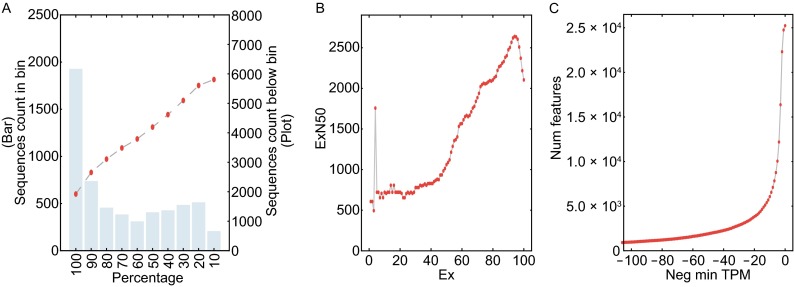
Assembly quality assessment. (A) Full-length transcript assessment. Bin on x-axis represent the percentage of the hit’s length included in the alignment to the Trinity transcript. Left y-axis with bar plot is the transcript count in each bin and right y-axis with point plot is the accumulate count below that bin. (B) N50 of subset of transcript by decreasing the expression level. Ex is the top most expressed transcripts that represent x% of the data. ExN50 is the length of a transcript while the total length of transcripts shorter that it reached 50% of total length of all transcripts in this dataset. (C) Transcript count with a threshold of negative minimum TPM value