
Figure 5.
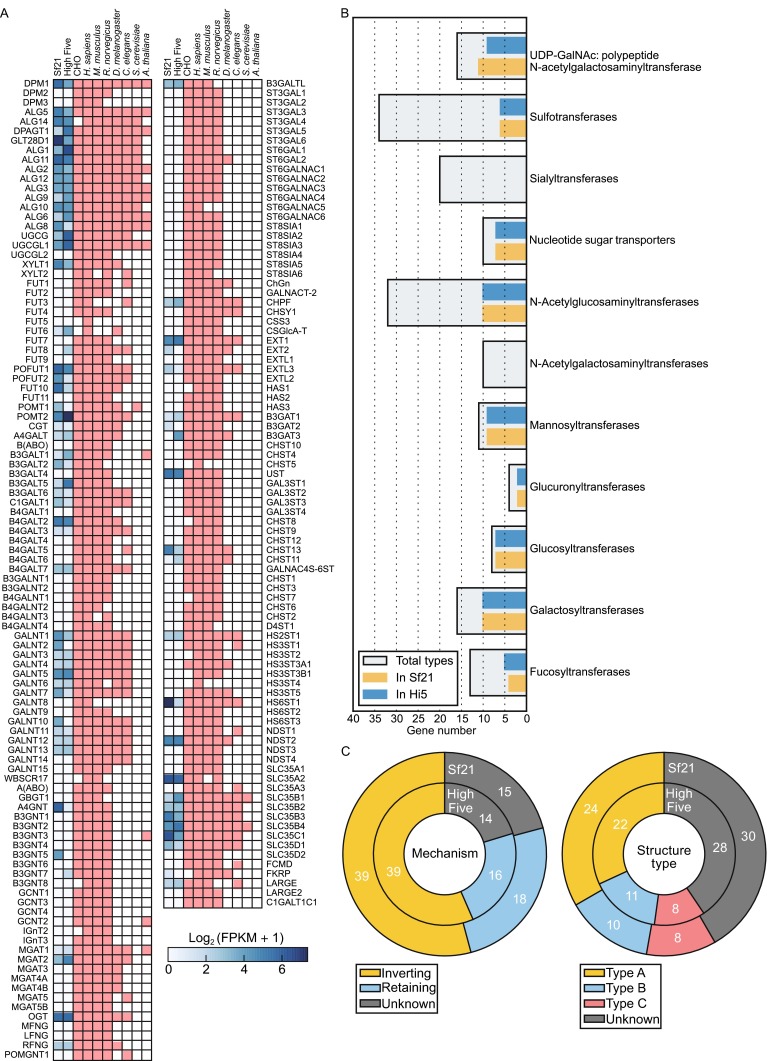
Glycogene profile of High Five and Sf21 cell line. (A) Heatmap represents the gene constituent of each species. Blue mark of Sf21 and High Five showed the expression value of each gene. Red mark only represent they have this gene. (B) Bar plot of glycogene categories. (C) Ring plot representing the properties of glycogenes in High Five and Sf21 cell lines