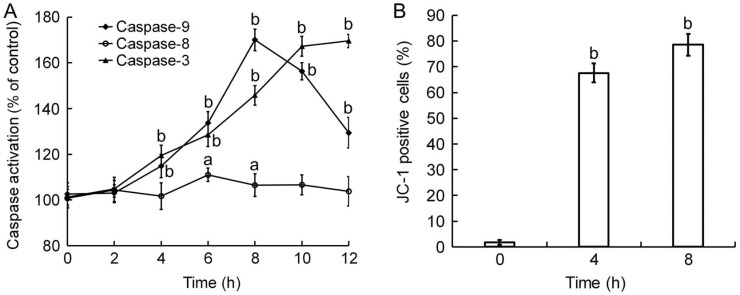
Figure 5. Caspase activation and MTP disruption of 0.3125 g/L Tetracaine-treated HCEP cells.
A: ELISA using monoclonal antibodies to the active forms of caspase-3, -8, and -9. The activation ratio of caspases in each group was expressed as percentage (mean±SD) compared to its corresponding control based on 490 nm absorbance (n=3). B: FCM with JC-1 staining. The cell number of JC-1 positive (MTP disrupted) HCEP cells in each group was expressed as percentage (mean±SD) of its total cell number (n=3). aP<0.05, bP<0.01 versus control.

