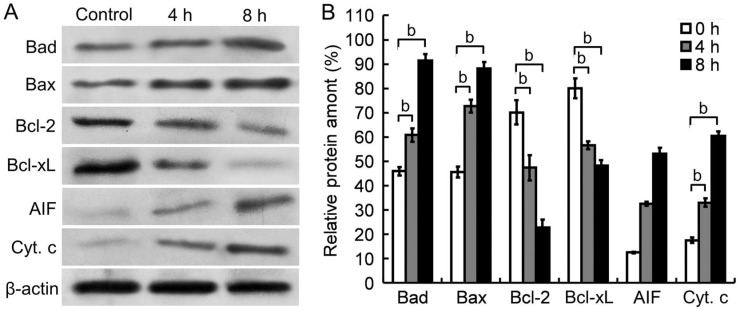
Figure 6. Western blots of apoptosis-triggering proteins in 0.3125 g/L Tetracaine-treated HCEP cells.
A: Western blot images. The cytoplasmic Cyt. c and AIF, and the expression pattern of Bcl-2 family proteins in HCEP cells were shown. B: Densitometry analysis. The relative level of protein amount was expressed as percentage (mean±SEM) of protein band density compared to an internal control of β-actin (n=3). aP<0.05, bP<0.01 versus control.

