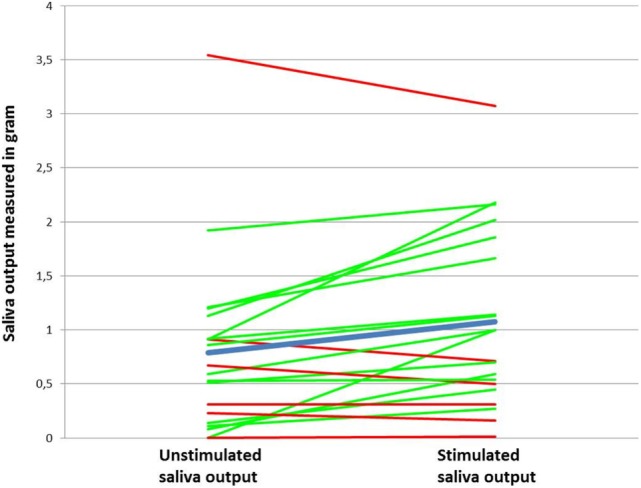
Figure 1.

Increase and decrease in saliva output after stimulation with the chewing gum (n = 20) from Visit 1. The green line represents an increase in saliva output after stimulation. The red line represents a decrease or no change. The blue line represents the mean value.
