Figure 2.

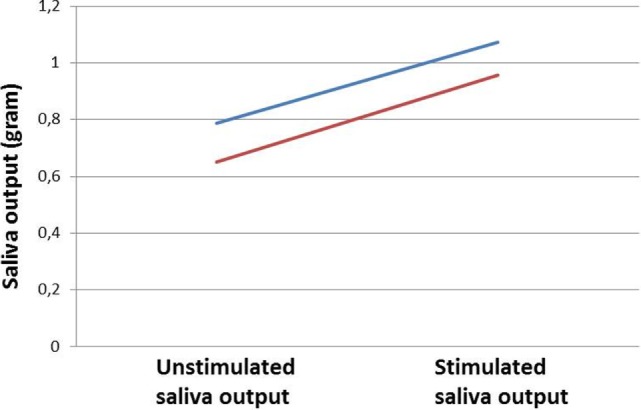
Mean output for unstimulated and stimulated saliva measured in grams. The blue line represents saliva output at Visit 1 and the red line at Visit 2.

Mean output for unstimulated and stimulated saliva measured in grams. The blue line represents saliva output at Visit 1 and the red line at Visit 2.