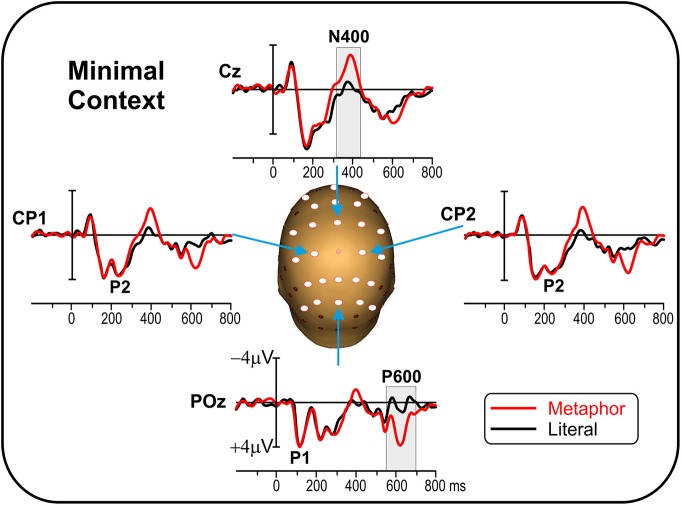
Figure 1.
Experiment 1 (minimal context): Grand average ERP waveforms for metaphor and literal conditions on representative electrodes. The main ERP components are labeled. Gray bars indicate the time windows used for statistical analysis. Circles indicate the 25 electrode sites used in the analysis.

