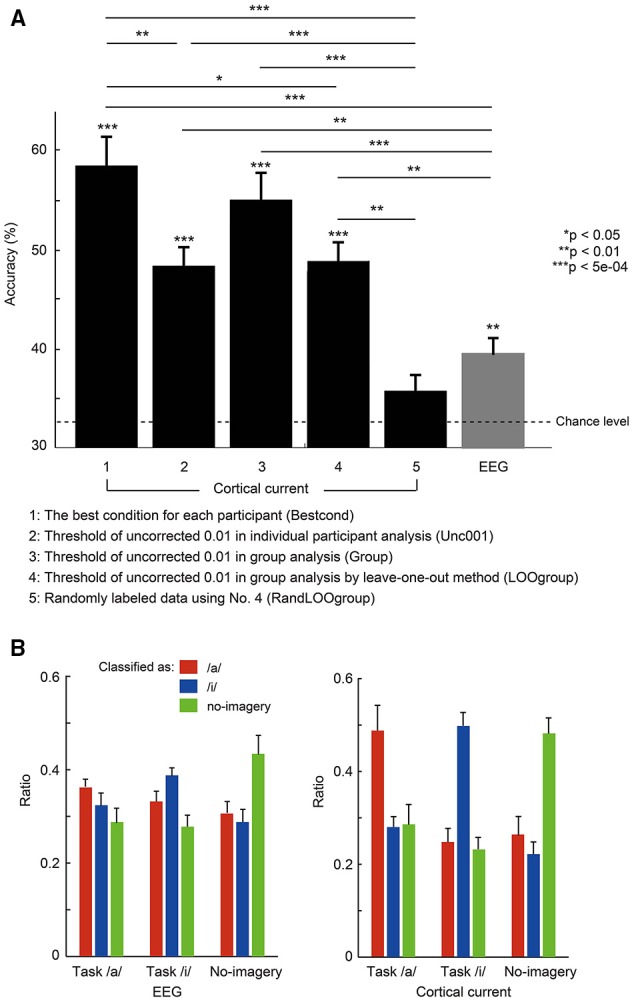
Figure 4.

(A) Mean accuracies averaged across 10 participants for the three-class classification using EEG sensor and cortical current data. Error bars denote standard error. The dotted line denotes chance level of 33.3%. *p < 0.05, **p < 0.01, ***p < 5e-04 usnig non-parametric permutation tests. Parameters used for each condition (No. 1–No. 5) are shown in Table 1. (B) Comparison of classification output ratio for each task resulting from EEG sensor (left) and cortical current (right) classification. Using a probability map from each classification analysis, the number of times that marked the highest probability was counted for each task. Then the ratio of that number to the total number of cross-validations was calculated and averaged across participants. For each task, red bars represent the ratio classified as vowel /a/, blue bars as vowel /i/, and green bars as no-imagery.
